Table of contents
Benchmarks’ code are available on GitHub.
Note benchmarks only record certain aspect of the code and the setup environment, they may not reflect real-world use-case. Any patches to improve the simulation as practical as possible are welcomed.
JSON performance
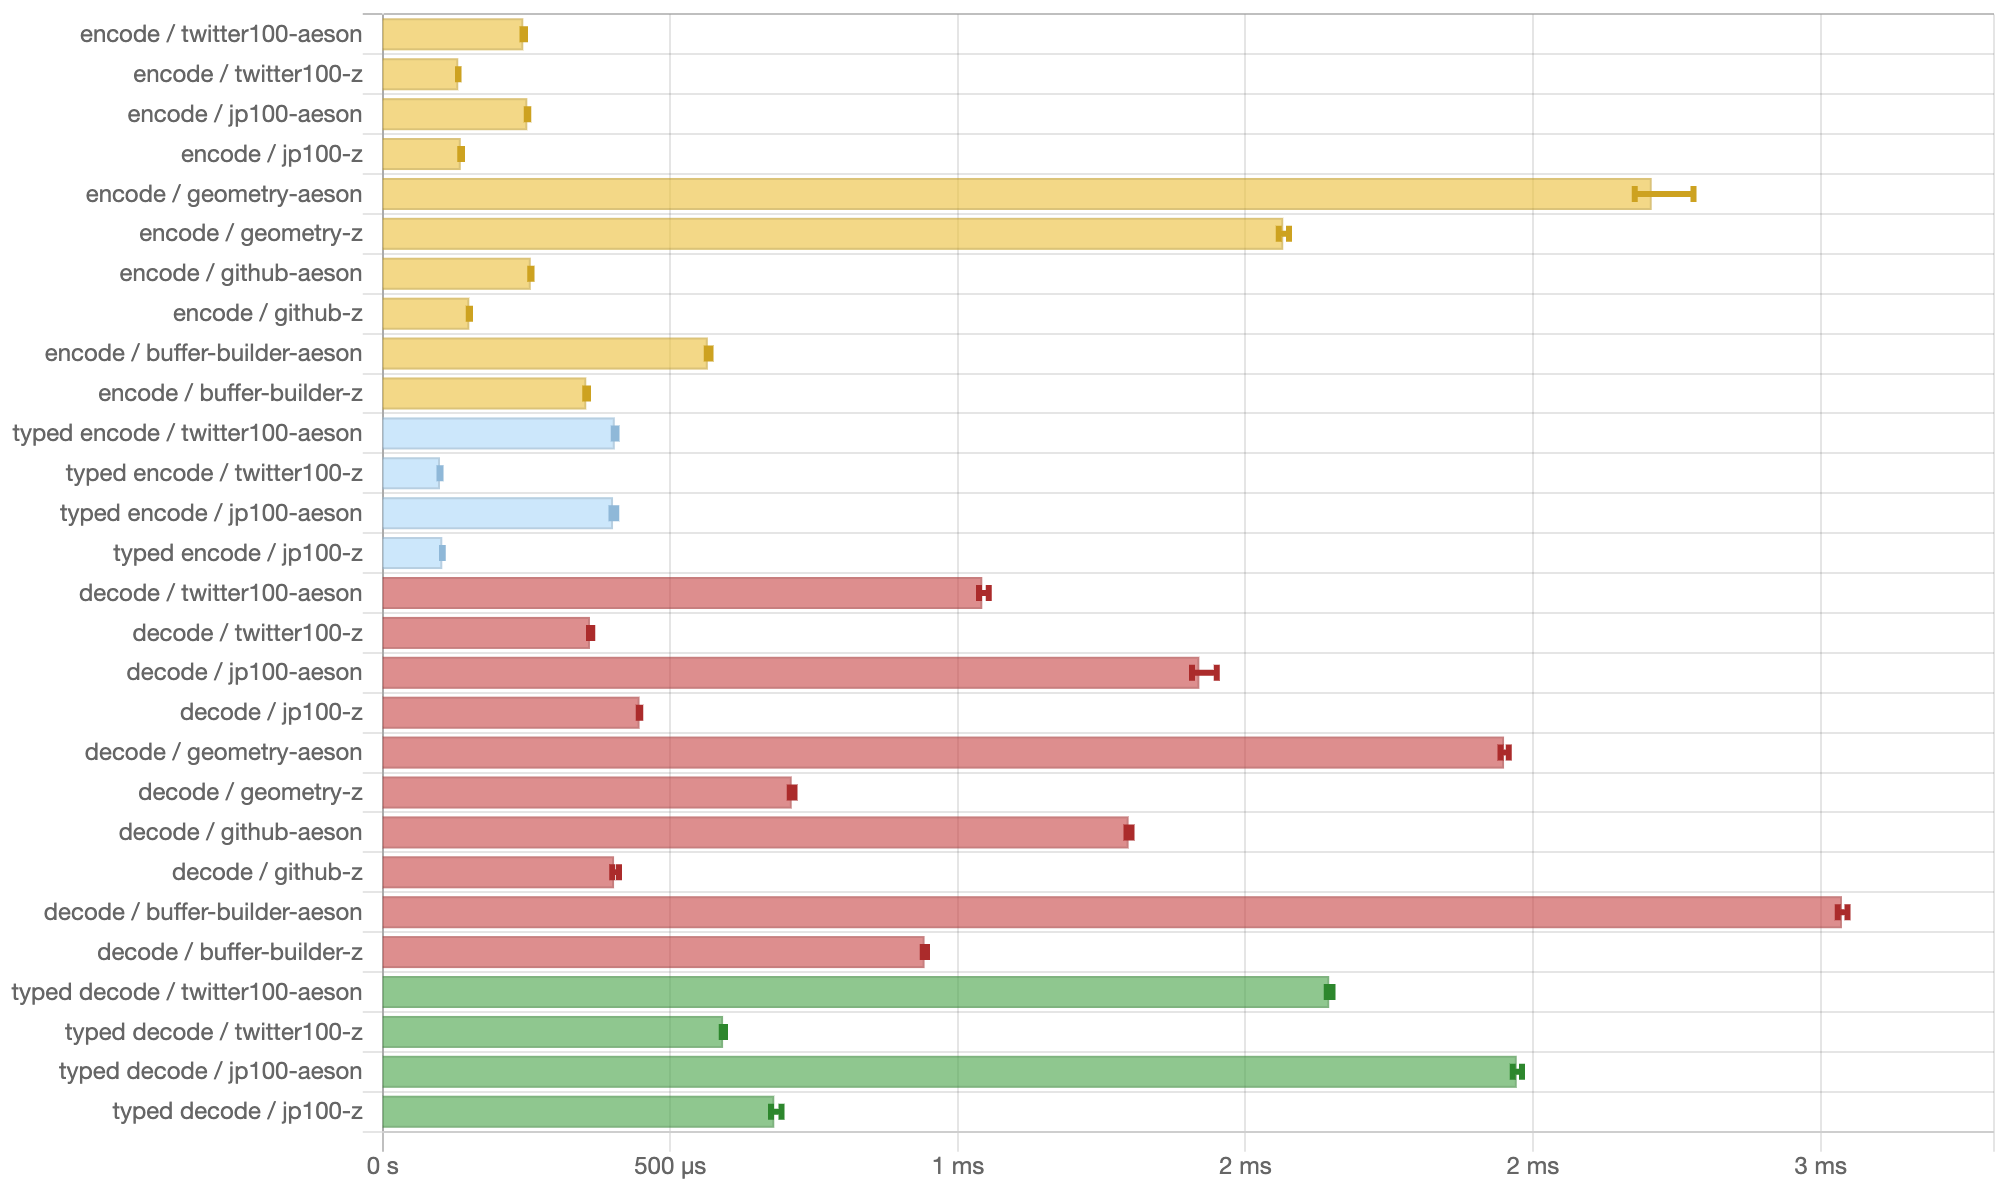
This benchmark compared JSON module in Z-Data with aeson, a widely used JSON package on hackage. See our analysis in this blog post.
TCP performance
This benchmark compared different redis PING-PONG server implementations, using redis-benchmark tool from redis package running redis-benchmark -p 8888 -t ping -n 100000 -q -c 100.
# Haskell's network package
# cabal run redis-benchmark-base -- +RTS -N4 -H2G
PING_INLINE: 88105.73 requests per second
PING_BULK: 87873.46 requests per second

# Z-IO from Z.Haskell
# cabal run redis-benchmark-z -- +RTS -N4 -H2G
PING_INLINE: 99800.40 requests per second
PING_BULK: 102459.02 requests per second

# Golang standard lib
PING_INLINE: 98716.68 requests per second
PING_BULK: 101522.84 requests per second

# Rust mio
PING_INLINE: 111731.84 requests per second
PING_BULK: 112612.61 requests per second

# C libuv
PING_INLINE: 109170.30 requests per second
PING_BULK: 105374.08 requests per second
Note both mio and libuv using a single thread event loop and a shared buffer to receive redis-benchmark’s messages between different connection, which is quite different from other lightweight thread based implementations.
GHC also provides memory statistics:
# Haskell's network package
# cabal run redis-benchmark-base -- +RTS -N4 -s -H2G
 3,751,313,096 bytes allocated in the heap
     302,793,568 bytes copied during GC
       1,869,864 bytes maximum residency (1044 sample(s))
         490,016 bytes maximum slop
            2085 MiB total memory in use (0 MB lost due to fragmentation)

                                     Tot time (elapsed)  Avg pause  Max pause
  Gen  0      2085 colls,  2085 par    0.455s   0.131s     0.0001s    0.0085s
  Gen  1      1044 colls,  1043 par    0.419s   0.149s     0.0001s    0.0226s

  Parallel GC work balance: 82.10% (serial 0%, perfect 100%)

  TASKS: 10 (1 bound, 9 peak workers (9 total), using -N4)

  SPARKS: 0 (0 converted, 0 overflowed, 0 dud, 0 GC'd, 0 fizzled)

  INIT    time    0.001s  (  0.001s elapsed)
  MUT     time    5.360s  (  5.842s elapsed)
  GC      time    0.874s  (  0.280s elapsed)
  EXIT    time    0.001s  (  0.008s elapsed)
  Total   time    6.236s  (  6.130s elapsed)

  Alloc rate    699,915,737 bytes per MUT second

  Productivity  85.9% of total user, 95.3% of total elapsed

# Z-IO from Z.Haskell
# cabal run redis-benchmark-z -- +RTS -N4 -s -H2G
 280,828,448 bytes allocated in the heap
         835,688 bytes copied during GC
       3,375,112 bytes maximum residency (4 sample(s))
         839,672 bytes maximum slop
            2084 MiB total memory in use (0 MB lost due to fragmentation)

                                     Tot time (elapsed)  Avg pause  Max pause
  Gen  0         5 colls,     5 par    0.009s   0.008s     0.0015s    0.0073s
  Gen  1         4 colls,     3 par    0.023s   0.021s     0.0052s    0.0194s

  Parallel GC work balance: 82.81% (serial 0%, perfect 100%)

  TASKS: 14 (1 bound, 13 peak workers (13 total), using -N4)

  SPARKS: 0 (0 converted, 0 overflowed, 0 dud, 0 GC'd, 0 fizzled)

  INIT    time    0.001s  (  0.001s elapsed)
  MUT     time    2.811s  (  6.757s elapsed)
  GC      time    0.032s  (  0.028s elapsed)
  EXIT    time    0.002s  (  0.004s elapsed)
  Total   time    2.846s  (  6.790s elapsed)

  Alloc rate    99,903,441 bytes per MUT second

  Productivity  98.8% of total user, 99.5% of total elapsed